One plan for your entire supply chain.
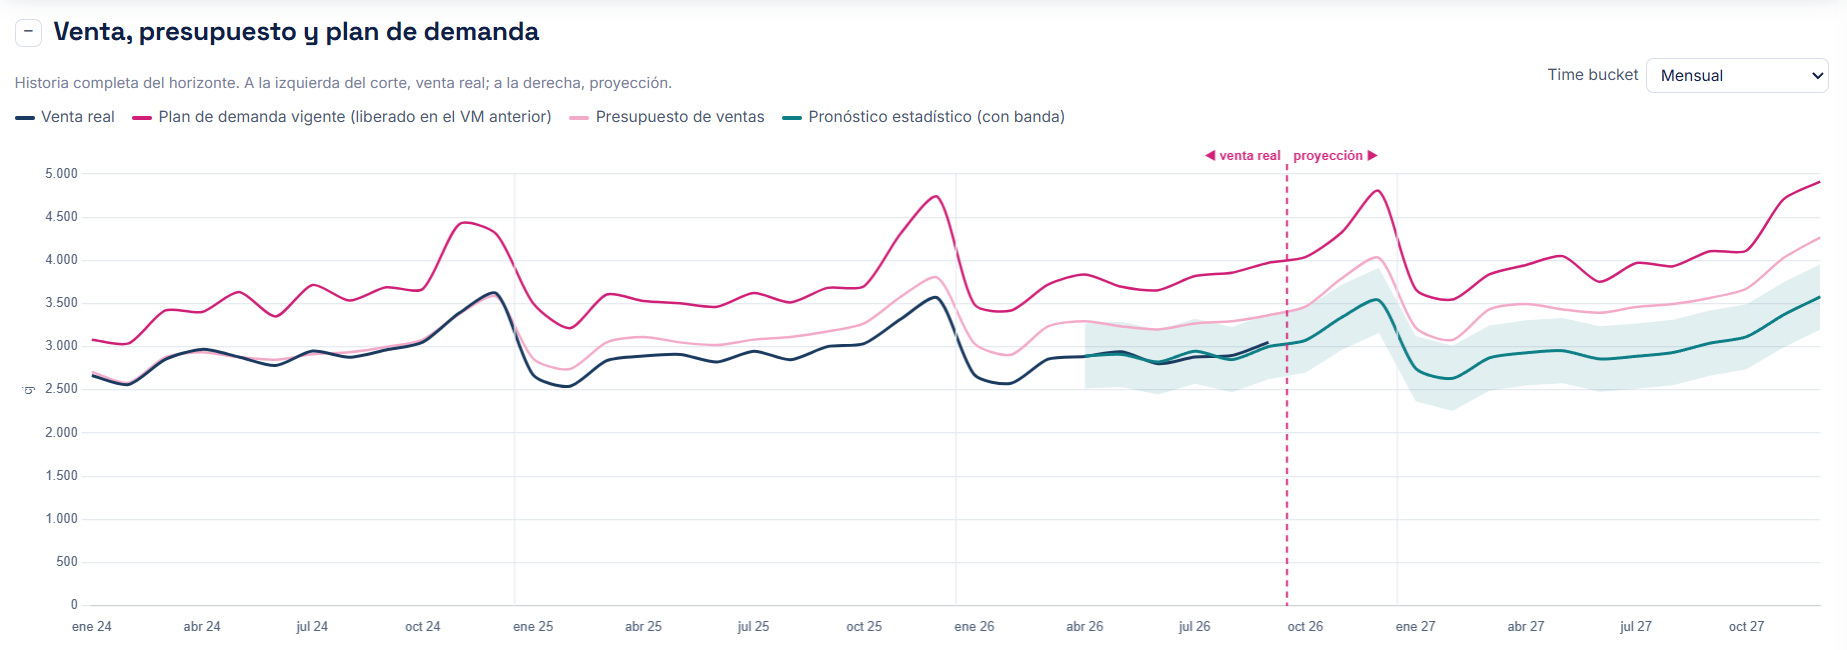
Portfolio, demand, supply, financial gap and executive approval: the five steps of the IBP cycle in one system, with the same numbers for sales, operations and finance.
- Cycle
- 5 steps, monthly
- Horizon
- 24 months
- Units
- Cases, hours, COP and USD
- Organizations
- Multiple, with isolated data
- Languages
- English · Español
IBP Control Tower
The software to run your company's IBP cycle on your own data. Register your company, invite your team and assign roles by function.
IBP Certification
Learn the full IBP cycle by working through a business case, step by step: from portfolio to plan sign-off.
IBP is not a monthly report. It is how leadership makes decisions.
Integrated Business Planning is the evolution of S&OP. It is a monthly process, led by the general manager, that aligns portfolio, demand, supply and financial decisions into a single plan over a horizon of 24 months or more.
Where traditional S&OP balances volume —how much to sell and how much to make— IBP translates it into value: revenue, margin, inventory and EBIT, and compares it with the budget. Every cycle ends in decisions with an owner, a date and a financial impact.
| Traditional S&OP | IBP | |
|---|---|---|
| Focus | Balance demand and supply | Integrated business plan |
| Units | Cases, units, hours | Volume and value |
| Horizon | 3 to 18 months | 24 to 36 months |
| Led by | Operations | General management |
| Portfolio | Outside the process | First step of the cycle |
| Outcome | Production plan | One approved plan and financial scenarios |
From portfolio to plan sign-off, without switching tools.
Each meeting answers one question and hands something to the next.
One month, one cycle.
Meetings have fixed dates after the accounting close. What comes out of one is what goes into the next.
Built by planners, for the real meeting.
The metrics that drive decisions.
| KPI | Formula | What it tells you | Step |
|---|---|---|---|
| Forecast accuracy | 1 − |actual − forecast| ÷ actual | How close the plan was to what happened | Volume |
| Bias | Σ(forecast − actual) ÷ Σ actual | Whether the plan always misses in the same direction | Volume |
| Full-year estimate | YTD sales + DTG | How the year closes against budget | Volume |
| Cover days | inventory ÷ demand × 30 | How many days of sales the inventory covers | Supply |
| % Utilization | required hours ÷ available time | Above 100% the plan does not fit on the line | Supply |
| GMROI | gross margin ÷ average inventory at cost | How much margin each dollar of inventory returns | Portfolio |
| Contribution I | (sales − variable cost) ÷ sales | What each SKU contributes before fixed costs | Portfolio |
| EBIT margin | EBIT ÷ net sales | Compared in points against budget and prior year | GAP |
How far is your supply chain from a good benchmark?
Before improving a process you need to know where it stands. Enter your planning KPIs, compare them with a reference and walk away with the gap most worth closing first, ready to discuss with your team.
Five formulas, five different answers. Which one is yours?
Safety stock protects service level against what cannot be planned: variation in demand and in replenishment time. Each method starts from different assumptions. Calculate them with your data and compare them side by side.
Let's talk about your planning process.
I'll walk you through the full cycle with sample data and we'll discuss how to load yours. If you'd rather start by knowing where you stand, measure your organization's IBP maturity.